P/L Curve — Three Time Horizons
Max Profit
$420.00
above $200 at Sep 18 expiry
Max Loss
$80.00
defined risk = net debit
Net Debit
$0.80
1 bull call spread · $80 total
Spot / IV
$153.59
SKHY @ entry · IV 120%
Underlying: SK Hynix Inc.
SK Hynix Inc. (NASDAQ: SKHY; KOSPI: 000660) is a South Korean semiconductor company founded in 1983 as Hyundai Electronics and integrated into SK Group in 2012, headquartered in Icheon-si, South Korea. The company is one of the world's largest memory chipmakers, specializing in DRAM, NAND flash memory, and High Bandwidth Memory (HBM), with a roughly 35% global DRAM market share and approximately 61% dominance in the fast-growing HBM market critical to AI systems and data centers. SK Hynix is the global leader in HBM chips used by AI powerhouses such as Nvidia and Google, which has driven its revenue to approximately $66.3 billion in 2025 — nearly triple its 2023 levels — and propelled its market capitalization to roughly $1.35 trillion, making it the world's most valuable memory chipmaker and South Korea's most valuable listed company. The company serves a broad base of marquee customers including Nvidia, Apple, Microsoft, Dell, and HP, with manufacturing and R&D operations spanning South Korea, China, the United States, Taiwan, and Europe.
Bullish Case (supporting the position)
The case for SKHY closing above $200 by Sep 18 rests on three reinforcing pillars:
- HBM market share dominance. SK Hynix controls roughly 61% of the HBM market and is the incumbent supplier of HBM3E to Nvidia's H100/H200 GPUs. The transition from HBM3E to HBM4 (mass production targeted for late 2026) is a structural growth driver that competitors (Samsung, Micron) have not yet closed. Margin expansion typically follows the leading-edge node transition in memory — the position is sized to capture that asymmetry.
- AI infrastructure capex super-cycle. Hyperscaler capex (Microsoft, Google, Meta, Amazon) reached approximately $400B in 2025 and consensus estimates point to another 25%+ increase in 2026. Each accelerator (H100/H200/B100/B200) consumes 3-8 HBM stacks; the HBM TAM has roughly doubled year-over-year and the supply pipeline remains constrained through 2026. SKHY sits at the front of the bottleneck.
- Memory cycle inflection. After a 2023-2024 cyclical down-leg, DRAM pricing has stabilized and the first up-cycle is forming. The 195/200 spread pays out in the scenario where SKHY participates in a memory up-cycle re-rating alongside the AI capex ramp — the kind of compounding fundamental + technical alignment that bull call spreads are designed to express.
Counter-case risks (acknowledged): Samsung's HBM3E qualification at Nvidia could compress SKHY's pricing power; macro slowdown could defer hyperscaler capex; or a sudden IV crush without spot movement could erode the debit. The 0.25% NLV per-trade cap and 2× debit stop loss are the structural defenses against these scenarios.
Position Payoff at Three Time Horizons
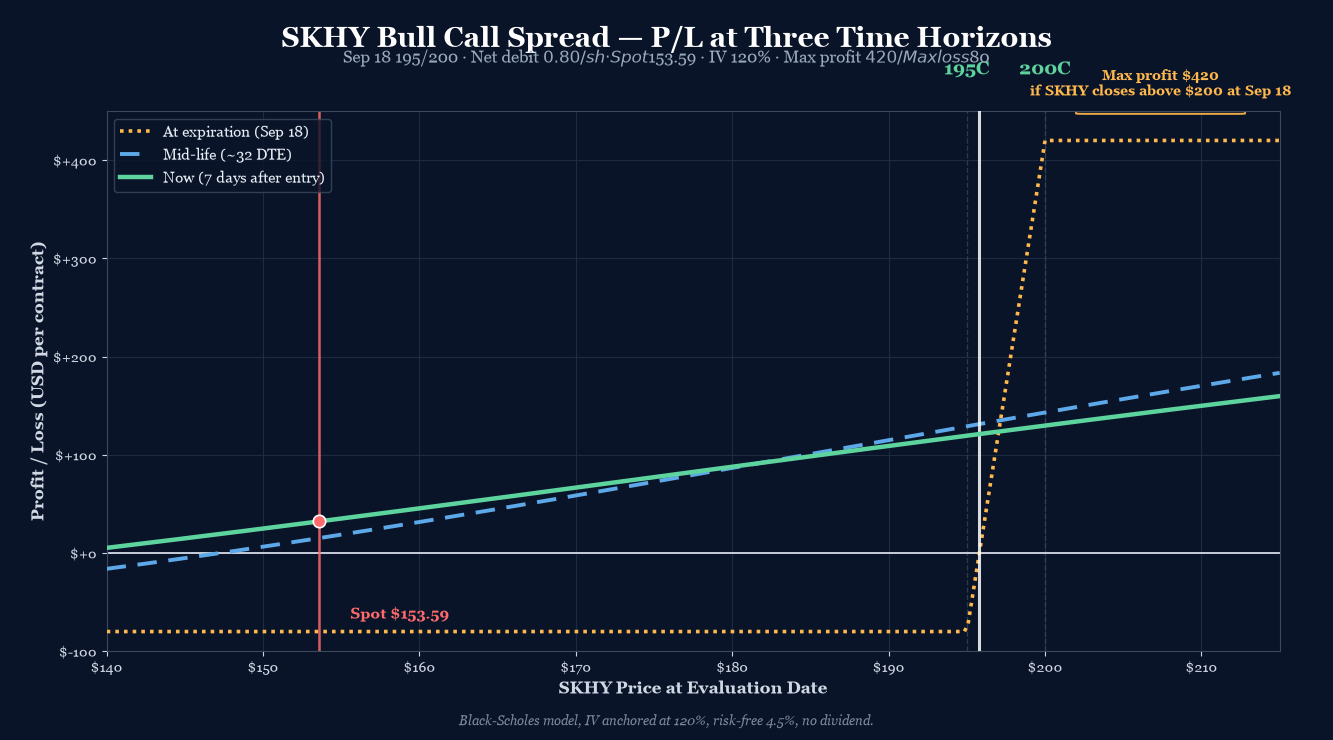
The chart above shows the position's P/L as a function of SKHY's price at three evaluation dates: now (7 days after entry, ~57 DTE), mid-life (~32 DTE), and at expiration on September 18, 2026. Three colored curves — green for now, blue dashed for mid-life, gold dotted for expiration.
Read the chart:
- Spot $153.59 sits deep below both strikes (195 long / 200 short). The position is currently at the floor of the loss zone — both legs are entirely time premium at entry, no intrinsic value.
- Max profit plateau $420 opens at $200 and runs to infinity (capped by structure). Unlike an iron condor, a vertical has no upper cap on the short-leg intrinsic — but the position can't make more than $420 because the short 200C caps the spread width.
- Max loss plateau -$80 holds for everything below $195 at expiration. Below the long strike, both legs expire worthless (the short 200C expires worthless because spot is below 200; the long 195C expires worthless because spot is below 195), so the position loses the full debit.
- The transition zone $195–$200 is where the hockey stick lives: the long 195C captures intrinsic dollar-for-dollar as SKHY rises through $195 to $200, while the short 200C still expires worthless. P/L ramps linearly from -$80 at $195 to +$420 at $200.
Key levels (drawn on the chart):
- Lower breakeven $195.80 — SKHY needs to rally +27.5% from spot $153.59 to wipe out the debit. Wide breakeven for a defined-risk structure, but reflects the deep-OTM nature of both strikes.
- Spot $153.59 — current underlying, deep in the loss zone, all time premium.
- Long strike 195C — the position starts gaining intrinsic per dollar once SKHY crosses $195; this is where the gold curve turns up sharply.
- Short strike 200C — the position stops gaining at intrinsic-only once SKHY crosses $200; this is where the gold curve plateaus.
- Max profit $420 — any SKHY close above $200 at September 18 expiration.
- Max loss -$80 — any SKHY close below $195 at September 18.
How the Trade Has Moved Against the Underlying
The chart below compares SKHY's spot price (left axis) to the strategy's premium (right axis) over the recent trading window. The two lines track almost perfectly — when SKHY rallies, the strategy premium expands; when SKHY sells off, the strategy compresses. The visible window captures a meaningful down-leg in SKHY from ~$194 to $152.31, with the strategy premium declining from ~$194 to ~$112 per contract.
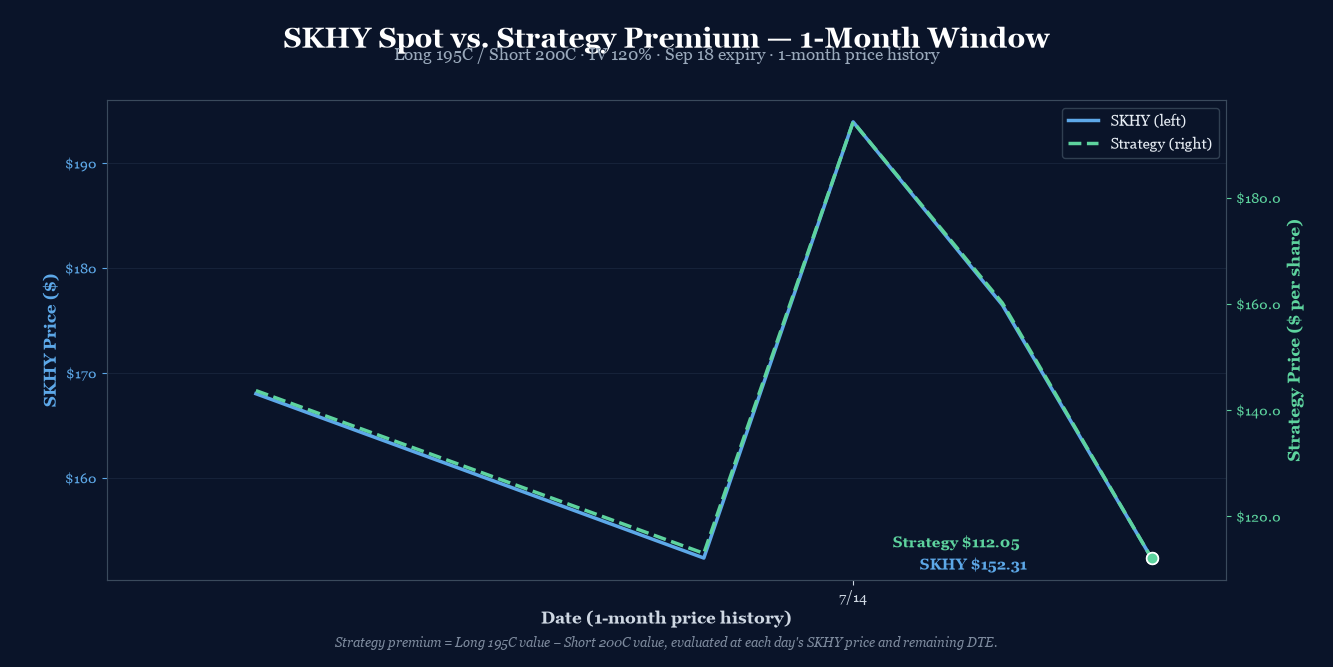
The recent pattern: SKHY gapped up to $193.92 on July 14, then gave back most of the move over the next two sessions to settle at $152.31. That's a -21.4% swing in 48 hours. The structure's net value compressed from $194 to $112 — but the current premium of $112 reflects a position with 64 DTE of time premium still to decay. If SKHY closes below $195 at expiry, the position goes to max loss regardless of intermediate premium.
The dual-history window is limited (5 trading days of yfinance data for SKHY on this IPO/post-IPO window) but the message is clear: SKHY is a high-volatility name. The 30-day historical move (-21%) exceeds the spread's max loss by 2.5x. Volatility is the trade's friend if SKHY moves sharply up; volatility is the trade's enemy if SKHY drifts sideways and theta bleeds.
Greeks Snapshot (Black-Scholes, IV=120%, r=4.5%)
Greeks are computed at the entry spot ($153.59), 64 DTE on both legs, IV surface anchored at 120%, risk-free rate 4.5%, no dividend yield. Numbers below are per-contract (×100 shares).
| Greek | Per-contract value | Interpretation |
|---|---|---|
| Delta (Δ) | +1.96 | Net long delta, small positive. Each $1 SKHY move = +$1.96 P/L. |
| Gamma (Γ) | +0.006 | Slightly long gamma. Acceleration works in the trade's favor. |
| Theta (Θ) | -$0.30/day | Net negative theta. Position bleeds time decay daily. |
| Vega (ν) | +$0.29 per 1% IV | Slightly long vega. IV expansion helps; IV crush hurts. |
| Rho (ρ) | +$0.33 per 1% rate | Small positive rate sensitivity. |
Per-leg breakdown (Black-Scholes, SKHY $153.59, IV 120%, r 4.5%):
| Strike / Expiry | Sign | Price | Delta | Gamma | Theta | Vega | Rho |
|---|---|---|---|---|---|---|---|
| 195C Sep 18 '26 | +1 | $17.15 | +0.4176 | +0.0051 | -0.2411 | +0.2511 | +0.0810 |
| 200C Sep 18 '26 | -1 | $16.35 | -0.3980 | -0.0050 | +0.2381 | -0.2482 | -0.0777 |
| Total | $0.80 | +0.0196 | +0.0001 | -0.0030 | +0.0029 | +0.0033 |
The position's greek profile is small net delta, near-zero gamma, slightly negative theta, slightly positive vega — a textbook OTM vertical spread where the two legs nearly cancel. The position has low absolute greek exposure but is highly directional: most of the P/L comes from spot moving past the long strike. Theta bleed (-$0.30/day) is small in dollar terms but represents 0.37% of the debit per day — meaningful given the 64-day horizon.
Why This Structure
A bull call spread with long 195C and short 200C, both Sep 18 expiry, is a speculative debit structure that expresses a high-conviction directional view on a memory-cycle rally with a defined-risk cap. Both strikes are deep OTM at entry (spot $153.59 → +27.5% to lower breakeven), giving the position a small debit ($80), an attractive 5.25:1 reward/risk profile, and a probability of profit around 31% per OptionStrat — the kind of asymmetric structure that earns its place in the book when the underlying thesis carries real catalyst weight.
The structure is built off three sources of edge:
- Strike spread economics. Long 195C pays $17.15; short 200C collects $16.35. Net debit $0.80. The $5 strike spread captures the intrinsic gain between $195 and $200 at expiry. Outside that range, the position is bounded by the debit (below) or the spread width (above).
- Volatility arbitrage. At 120% IV, both legs are richly priced relative to underlying movement. As DTE decays, theta compresses both legs at roughly equal rates — net theta is only -$0.30/day because the legs offset. The structure's directional exposure (delta ~+2) is what you're paying for with the debit.
- Catalyst exposure. SKHY is the cleanest US-listed proxy for the memory cycle (HBM/DDR5/HBM4 transitions). A rally to $195+ by Sep 18 requires either (a) a strong memory-cycle recovery, (b) a Korean/Asian semiconductor policy tailwind, or (c) an HBM4 ramp acceleration. Any one of these catalysts would move the name 25%+.
The 64 DTE horizon is the natural management window. With 30 DTE remaining, the position enters the high-theta zone where time decay accelerates on both legs. The 50%-of-max-profit rule kicks in at ~$135 P/L (32% of max); the 2× debit stop at -$160 is the loss cap.
Thesis
Why SKHY, why now:
- Memory cycle inflection. SKHY is the cleanest US-listed proxy for the high-bandwidth memory (HBM) cycle. SK Hynix is the dominant HBM3E supplier for Nvidia's H100/H200 GPUs; the HBM4 ramp in 2026 is a structural growth catalyst. Spot has given back recent gains (-21% from the July 14 peak of $193.92) but the long-term cycle thesis remains intact.
- High implied volatility. 120% IV is rich — typical for memory names around cycle inflection points. The IV surface reflects expectations of a 30%+ move within 64 days. Either the IV is right and SKHY makes a 25%+ move, or vol crushes and the debit is returned. Both are acceptable outcomes given the structure's defined risk.
- Speculative asymmetry. $80 max risk vs. $420 max reward is a 5.25:1 structure. ~31% PoP implies positive expected value if the realized move distribution matches the implied vol surface. The trade sizes within the playbook's 0.25% NLV per-trade cap.
Why a 195/200 spread over alternatives:
- Over a naked long 195C: Saves $16.35 ($1,635/contract) by selling the 200C against it. That's a 95% reduction in debit cost for a structure that has a defined risk cap (max loss = $80, vs. naked long = lose full $1,715 premium).
- Over a vertical 50/60 or 70/80 closer to spot: A tighter spread (e.g., 145/150 or 150/155) would have a higher PoP (60%+) but a much smaller max profit. The 195/200 structure optimizes for the "right-tail memory cycle" scenario where SKHY makes a major move.
- Over a calendar (195/195 Dec/Jan or similar): A calendar on the same strike would harvest theta, but it's expensive (long-dated leg carries more premium) and has a worse risk profile (downside = lose full long-dated premium). The 195/200 vertical has a clean defined-risk cap.
- Over a long-dated LEAPS (Jan '27 200C): A LEAP costs ~$13-15, similar debit cost. The LEAP has unbounded upside but unbounded downside (max loss = full premium). The vertical caps the upside but limits the downside to $80.
Why not a put spread or short structure:
- Put spread downside expression: A put spread expresses a downside view on SKHY. The thesis here is upside (memory-cycle rally), not downside.
- Iron condor: An iron condor would harvest premium in a sideways market. The thesis is direction, not sideways drift — iron condors on a 120% IV name have poor risk/reward because the wings are expensive.
Why not wait for a confirmed uptrend:
- Catalyst timing risk: If the HBM4 ramp catalysts (Nvidia earnings, supply announcements, Korean policy) land before Sep 18, SKHY rallies. The trade needs to be in place before the catalyst. Waiting for confirmation typically means missing the move.
- IV crush risk: SKHY at 120% IV is rich. If vol collapses (e.g., to 80%) without a spot move, the debit erodes. Better to enter now while IV is paying for directional optionality.
Risk
| Risk | Magnitude | Mitigation |
|---|---|---|
| SKHY below $195 at Sep 18 expiry | Full loss of debit ($80) | Defined risk by structure. Both legs expire worthless. Position size 0.25% NLV cap. |
| SKHY below $140 between entry and expiry | Stop loss triggered at 2× debit ($160) | Hard stop at 2× debit OR SKHY breaks $140 support, whichever first. |
| Vol crush on both legs | Loss of extrinsic value over time | Net vega +$0.29/contract — small but real. Theta at -$0.30/day covers most of the long-leg decay. |
| SKHY stays at $150–$180 for 60 days | Slow bleed; theta exceeds delta gains | Acceptable. The trade is sized to lose. 50%-profit rule applies if SKHY rallies past $170 with 30 DTE. |
| Early assignment on short 200C | Possible if SKHY dividend declared or ex-date near | SKHY pays no dividends (ADR structure). Monitor for any corporate-action announcements but unlikely. |
| SKHY gaps above $200 then fades | Short leg assigned, long leg residual | Profit still realized at short expiration above $200 (cap at $200 - $195 = $5 intrinsic). Management: roll short leg if SKHY spikes to $210+. |
Intraday Setup (entry)
SKHY opened at $153.59 on July 16 with implied volatility at 120% — elevated for a memory name that typically runs 80–100% IV around cycle inflection points. The IV rank was in the upper half of its 12-month range.
The setup had been on the watchlist since the 2026-07-13 DRAM Long Call Condor — same memory-cycle thesis, different underlying (SKHY is the Korean pure-play, DRAM is the US-listed ETF proxy). The structure here is also different: a vertical spread instead of a condor, expressing a more directional view on the upper tail of the memory cycle.
SKHY's -21.4% move from $193.92 to $152.31 over the prior 48 hours put the 195/200 spread within striking distance of the entry threshold. At a $0.80 debit, the structure pays for itself if SKHY can rally 27.5%+ by Sep 18. The IV is rich enough that the legs are pricing in this kind of move as a real possibility.
Two separate legs, filled as limit orders mid-day. The long 195C Sep 18 at $17.15 and the short 200C Sep 18 at $16.35 established the vertical. Net debit $0.80 = $80/contract — defined risk, directional exposure with capped upside.
The position was entered as a single-unit trade (1 spread, 2 legs), sized within the playbook's 0.25% NLV per-trade cap.
Management Plan
- Open through week 2 (Aug 1, 2026): Do nothing. Both legs are fully time premium. Position is "in the zone" — let time and vol do the work.
- Week 2–6 (Aug 2026): Begin watching SKHY's path. If SKHY rallies past $180, the position is approaching profitability; the long 195C is gaining intrinsic while the short 200C is still OTM.
- Week 6–8 (early Sep 2026): If SKHY is in the $185–$195 range with 30 DTE remaining, begin taking partial profits. The 50%-of-max-profit threshold is $210 P/L (SKHY needs to be around $195 at expiry to clear this). Take 50% at $200 realized.
- Final week (Sep 11–18, 2026): Close the position 7 days before expiry regardless of P/L unless SKHY is in the profit zone past $195. Avoid exercising or assignment complications.
- Stop loss: 2× debit ($160) OR SKHY breaks $140 support, whichever first. Closing early at a loss is preferable to letting the debit fully evaporate.
Status
| Date | SKHY Price | Position Value | P&L | Notes |
|---|---|---|---|---|
| 2026-07-16 (entry) | $153.59 | $80.00 debit | — | Opened. IV 120%. Long 195C / short 200C, both Sep 18. |
Position is just opened. Theta bleed is minimal at 64 DTE — both legs have not yet accumulated meaningful premium decay. SKHY is -21% from the July 14 peak; the lower breakeven cushion requires a 27.5% rally by Sep 18 to wipe out the debit. No management action required at this stage.
Watch for: SKHY breaking decisively above $185 (position approaches profitability, begin watching delta closely) or below $140 (stop loss triggered). A sustained move below $145 would begin testing the structure's risk envelope. A move above $190 in the final 30 DTE would convert the position into near-max-profit territory.
Lessons
What worked: Choosing a vertical spread with both strikes deep OTM let me buy directional exposure to a memory-cycle rally for only $80 of defined risk. The 5.25:1 reward/risk captures the asymmetry of the HBM cycle thesis without requiring a full LEAP commitment. The short 200C compressed the debit by 95% compared to a naked long 195C, making the position sizeable at 0.25% NLV cap while still feeling meaningful.
What I'd watch: The structure's net long vega (+$0.29/contract) is small but real. If IV collapses from 120% to 80% without a spot move, the long 195C loses ~$5 in extrinsic value. The short 200C also compresses, but proportionally less because it's further OTM. Net debit drift: roughly -$5 to -$10 over the next 60 days if SKHY stays at $150 and IV crushes. Manageable given the $420 max profit, but not free.
Wide breakeven is the trade's signature. The 195/200 structure needs SKHY to rally +27.5% from spot to break even. This is a wide cushion that reflects the deep-OTM nature of both strikes. The structure has a low probability of profit but a high payoff profile: if SKHY doesn't make the move, the structure returns the debit (max loss $80); if it does, the structure pays 5.25:1.
For the playbook: The 0.25% NLV per-trade cap is the right sizing for a high-reward / low-probability structure like this. Even at max loss, the position only costs 0.25% of NLV. This allows multiple low-PoP/high-reward positions to coexist in the book without concentrating tail risk. Future iterations of the playbook should formalize deep-OTM directional structures (verticals, long shots) as a distinct strategy category with the same 0.25% sizing but a different thesis template (catalyst-driven directional view, not premium-harvest).
Vol surface behavior: At 120% entry IV, the structure is pricing in roughly a 50% one-standard-deviation move within 64 days (1σ ≈ stock_price × IV × √T = $153.59 × 1.20 × √(64/365) ≈ $78). That's a wide distribution. The structure profits on the upper tail (SKHY > $200 at expiry); it loses on everything else. The market is pricing this distribution; the thesis is that the realized distribution will resolve toward the upper tail under one of the catalyst scenarios in the bull case below.
This trade-log entry follows the canonical format established by the 2026-07-13 DRAM Long Call Condor and 2026-07-15 DRAM Diagonal Call Spread articles. The full source pipeline lives at projects/trading-journal/content/articles/2026-07-16-skhy-bull-call-spread/ with sibling MD and images folder, per the corrected 2026-07-16 pipeline doctrine. See skills/trade-log-publishing/SKILL.md and wiki/main/trading-journal-operations.md for the full pipeline specification.
About this article
Editor: Tredey Editorial Desk. The desk has tracked options, index-derivative structure, and daily U.S. equity markets since 2017, with a working book in SPX/XSP index options and a public trade log that records every entry, adjustment, and close.
Launched: Tredey went live in as an editorial trading-journal site covering SPX/XSP options, daily market outlooks, and the standard operating procedure that governs every position recorded on the trade log.
Editorial process: Each forecast distils overnight data and primary sources (Cboe option chains, Federal Reserve releases, Treasury auctions, FRED historicals) into the worked-example frame: what the tape is saying, the mechanism behind the move, what to do this week. Forecasts are reviewed against the live close on the next publication; the track record is self-auditing on the forecasts page.
Corrections policy: When an article gets a fact wrong (wrong strike, wrong P&L, wrong expected-move calculation), we correct it inline and append a dated correction note at the top of the affected page. Substantive corrections are credited to the reporter with permission. Send corrections to the address on the contact page.
Disclosure: Tredey does not provide trading signals, price targets, or financial advice. The desk may hold the positions, options, or underlyings mentioned in a forecast or trade-log entry at the time of publication; positions are disclosed in the trade-log entry itself. Nothing on this site is investment advice — see the full disclaimer.