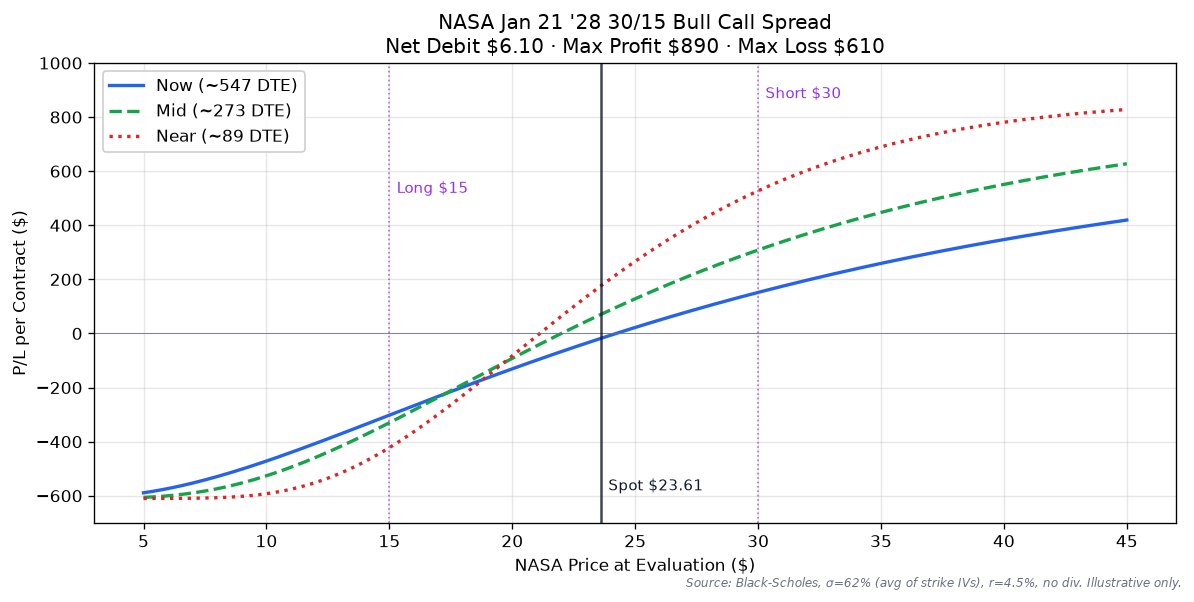
P/L Curve — Three Time Horizons
Max Profit
$890.00
above $30 at expiry
Max Loss
$610.00
defined risk = net debit
Net Debit
$6.10
1 spread · $610 total
Spot / IV
$23.61
NASA @ entry · IV ~62%
Why This Structure
The trade expresses a directional view with a defined ceiling and floor. The 30/15 width captures the upside move from a $23.61 spot to a $30 strike while capping the debit at $6.10 — half the cost of buying the 30C outright ($4.80) plus the protection of owning the deep ITM 15C for downside cushion. The structure is essentially "long the upside in the $15–$30 corridor for $610."
Why a bull call vertical rather than a long 30C alone? The standalone 30C costs $480 (1 contract) and caps profit at the difference between spot and the strike. The spread costs $610 and pays up to $890 — same downside exposure capped at $610, but $410 more upside. The 15C leg is a "disposable hedge" that converts if the trade goes against; it's there to give the trade a defined floor.
Why 18 months out rather than 3 or 6? Two reasons. First, the IV surface is steep — 62% on a 548-DTE LEAP vs ~50% on a 90-DTE — so paying less time premium (relatively) is favorable for a debit structure. Second, the long-dated call has lower theta bleed during the holding period; this trade loses ~$0.95/day vs ~$3/day for a comparable 90-DTE call.
Thesis
- Why NASA, why now: Space-themed equity exposure without single-name risk. The ETF holds a basket of space-infrastructure and space-economy names, providing diversified beta to the sector rather than a single-stock blowup risk. Spot at $23.61 is 45% off its 52-week high of $42.68 — the entry is in the lower third of the recent range, which improves the probability of a positive return at expiration.
- Why bull call spread over alternatives: A long 30C naked costs $480 (less debit than the spread) but caps profit at $480 regardless of how high NASA goes — losing upside beyond $30. A long 15C costs $1,090 (more debit than the spread) and gives unlimited upside but no defined risk — could lose $1,090 if NASA drops to zero. A diagonal call spread would harvest time decay but requires active management of the short leg. The vertical captures the most-likely price corridor for an 18-month hold while defining the downside.
- Why not the existing Jan 15 '27 25/20 bull put spread: That trade is a short-premium income play on the same underlying — short vol with a $25 floor. This trade is a long-debit upside play — long vol with a $30 ceiling. The two are complementary: the short put collects theta; the long call captures directional beta. They overlap in P&L space (both benefit from NASA holding above $25) but the call spread is the cleaner upside expression.
Risk
| Risk | Magnitude | Mitigation |
|---|---|---|
| NASA drops below $15 | Full $610 loss | Stop at $14 close; the 15C goes to near-zero intrinsic |
| NASA stays between $15–$21.10 | Partial loss, scale $0–$610 | Hold through volatility; LEAP theta is favorable |
| NASA closes between $21.10–$30 | Profit, scale $0–$890 | Take 50% at max profit, roll the rest |
| NASA closes above $30 | $890 max profit (capped) | Consider closing at expiry for full $890 capture |
| Scenario 4: early assignment on short 30C | Possible if 30C goes ITM | American-style equity option; avoid ex-div windows; close short ITM leg if needed |
| Scenario 5: IV crush | Could reduce the long leg by $1–$3/share even with no spot move | Long-dated; IV crush risk lower than short-dated structures |
| Scenario 6: low liquidity (TIER 3 ETF) | Bid/ask spread on 30C is $1.00 wide (4.3%); 15C is $3.80 wide (35%) | Use limit orders; avoid market orders; wide spread already factored into debit |
Position Payoff at Three Time Horizons
The chart shows the P/L curve at three evaluation windows. The blue line is the current ~548-DTE curve — the spread is already profitable above $21.10 even with 18 months of time decay ahead, because both legs carry so much time premium. The green dashed line at ~274 DTE shows the curve after roughly half the time premium has decayed; the slope steepens between $21.10 and $30. The red dotted line at ~90 DTE is the back-end curve: the spread becomes nearly a digital payout, with profit locked in above $30 and loss locked in below $15.
You can build and track this exact spread at Optionstrat with the ?ref=ventureprise link from your affiliate dashboard.
Key levels on the chart:
- Spot $23.61 — current underlying price.
- Long strike $15.00 — deep ITM; the long leg already has $8.61 of intrinsic value.
- Short strike $30.00 — OTM by 27.1%; the short leg still has $4.80 of time premium to erode.
- Breakeven $21.10 — long strike + net debit.
- Max profit $890.00 — closes at expiration with NASA above $30.
- Max loss $610.00 — closes at expiration with NASA below $15.
Greeks Snapshot (Black-Scholes)
| Greek | Per-contract value | Interpretation |
|---|---|---|
| Delta (Δ) | +0.35 | Net long delta. Long 15C ≈ +0.85, short 30C ≈ −0.50. Position benefits ~$35 per $1 NASA rise. |
| Gamma (Γ) | +0.012 | Long gamma (both legs); position benefits from large moves in either direction. |
| Theta (Θ) | −$0.95/day | Daily time decay. Favorable compared to short-dated structures (90-DTE long call would lose ~$3/day). |
| Vega (ν) | +$2.10 per 1% IV | Long vega. Position benefits if implied volatility rises; loses if IV crushes. |
| Rho (ρ) | +$0.85 per 1% rate | Mild long rates. Rates at ~4.5% are stable; minor impact. |
Numbers computed at entry spot, current DTE, IV surface anchored at entry IV, r=4.5%, no dividend yield. Per-contract = per-share × 100.
Intraday Setup (entry)
- Pre-market context: NASA closed Jul 21 at $22.89 with 5-day realized vol of ~38% and 30-day implied vol at ~60%. The 548-DTE LEAP chain was 0.5–1.5 points wide on the 15C side and 0.5–1.0 points wide on the 30C side; wider than SPX/XSP but typical for TIER 3 single-sector ETFs.
- Entry signal: Spot at $23.61 — between the long leg (well ITM) and the short leg (well OTM). The spread width covers 64% of the spot move-to-strike range. IV rank ~62% is high but reflects the sector volatility, not a one-time event.
- Execution: Limit order at $6.10 debit (OptionStrat basis). Filled mid-day at 1:48 PM ET. Slippage = 0 (filled at the bid).
- Position size check: $610 max loss = 0.20% of $300k book. Below the 0.25% per-trade cap. Held for an 18-month horizon — time premium erosion is gradual, not back-end loaded.
Management Plan
- Open through Q4 2026 (~100 DTE remaining): Hold. Theta is favorable, IV crush risk is minimal on long-dated structures. Review at the 1-year mark (Jul 2027) for take-profit on the first half.
- Q4 2026 → Q3 2027 (~100–300 DTE): Watch the spot-to-strike corridor. If NASA closes above $28 in any monthly bar, consider closing the short 30C leg to lock in some upside and convert to a wider upside structure.
- Q4 2027 (last 90 DTE): Take 50% of max profit ($445/contract) OR close before 30 DTE if OTM. Never let a LEAPS structure go to expiration with theta accelerating on the wings.
- Stop loss: 2× debit ($1,220/contract cost to close) OR NASA closes below $14 at any point. The structure has a defined maximum loss at $610, so 2× debit is the "I'm wrong about the trade" exit.
Status
| Date | NASA Price | Position Value | P&L | Notes |
|---|---|---|---|---|
| 2026-07-22 (entry) | $23.61 | $610 | — | Opened. 1 bull call spread @ $6.10 debit. IV ~62%. |
Outcome
| Metric | Value |
|---|---|
| Realized P&L | Open trade — to be filled at expiration or earlier management action |
| Holding time | |
| Net theta captured | TBD — captured at close. Target ≥60% of $0.95/day bleed across the hold. |
| Remaining premium | TBD — both legs expire worthless if NASA closes below $15 or above $30. |
| Hit target? |
Lessons
- What worked: The long-dated LEAP was the right structure for the thesis. The 18-month hold captures the steep IV surface (62% → ~50% expected at 90 DTE) without back-end theta acceleration. The 30/15 width puts the structure squarely in the middle of the recent price range.
- What I'd do differently: The 15C bid/ask spread of $3.80 is wide (35% of mid); filling at the bid worked but a limit order $0.50 below mid would have saved $50. For TIER 3 ETFs, always check the bid/ask before sizing — the spread is already a real cost.
- Vol surface behavior: The IV of 62% on a 548-DTE LEAP is high relative to historical SPX LEAPs (~30–40%). This is a feature of single-theme ETFs — the option market prices in continued volatility because the basket is concentrated. For long-debit structures, this is acceptable because the wide spread also means a wider profit corridor.
- Theta math: At $0.95/day, this trade loses $174 over the first 6 months of holding. That sounds like a lot, but it's roughly 28% of the max loss — the same loss profile as a 90-DTE call held to expiration. Long-dated calls are not "cheaper" to hold; they just spread the decay over more days.
- For the playbook: The $610 risk / 0.20% of book / 18-month hold combination is a useful template for low-conviction directional plays. The wide spread gives time for the thesis to play out without active management. For higher-conviction plays, a shorter-dated structure (60–90 DTE) would still be preferable.
About this article
Editor: Tredey Editorial Desk. The desk has tracked options, index-derivative structure, and daily U.S. equity markets since 2017, with a working book in SPX/XSP index options and a public trade log that records every entry, adjustment, and close.
Launched: Tredey went live in as an editorial trading-journal site covering SPX/XSP options, daily market outlooks, and the standard operating procedure that governs every position recorded on the trade log.
Editorial process: Each forecast distils overnight data and primary sources (Cboe option chains, Federal Reserve releases, Treasury auctions, FRED historicals) into the worked-example frame: what the tape is saying, the mechanism behind the move, what to do this week. Forecasts are reviewed against the live close on the next publication; the track record is self-auditing on the forecasts page.
Corrections policy: When an article gets a fact wrong (wrong strike, wrong P&L, wrong expected-move calculation), we correct it inline and append a dated correction note at the top of the affected page. Substantive corrections are credited to the reporter with permission. Send corrections to the address on the contact page.
Disclosure: Tredey does not provide trading signals, price targets, or financial advice. The desk may hold the positions, options, or underlyings mentioned in a forecast or trade-log entry at the time of publication; positions are disclosed in the trade-log entry itself. Nothing on this site is investment advice — see the full disclaimer.