P/L Curve — RSP #1 vs RSP #2 Comparison
Net Debit
$3.175
1 condor · $317.50 total
Max Profit
$682.50
between $230–$280 at expiry
Plateau Profit
$182.50
permanent above $287 at expiry
Spot / IV
$212.40
RSP @ entry · IV ~22% · RV 11.7%
Why This Structure
This is the second RSP long call condor opened today — a deliberate construction that takes the same $3.175/share net debit as RSP #1 (mBisziPFxRvo) but allocates the upper-body credit differently. The 230/280 short body is identical (collecting $14.30 + $2.20 = $16.50). The difference is on the wing side: where RSP #1 bought the 290C for $1.075 (a $10-wide upper body), this trade buys the 285C for $1.175 (a $5-wide upper body). The 285C is $0.10/share more expensive than the 290C, but the $5 narrower upper body stays in the structure permanently — RSP #2 keeps $182.50/contract above $287, where RSP #1 locks in a $317.50 max loss.
The key insight: at expiry, the long call condor's max payoff equals the narrower width minus the net debit, capped at the wider body's payoff. RSP #1 has equal widths ($10 lower, $10 upper) so max profit = $10 − $3.175 = $6.825/share ($682.50/contract). RSP #2 has asymmetric widths ($10 lower, $5 upper) but the linear payoff only matters between $230 and $280 — above $285, the structure settles at its permanent $182.50/contract floor (the upper body is 100% ITM and the structure's intrinsic no longer erodes).
The trade-off: the same $317.50 risk. The same $682.50 max profit if RSP closes between $230 and $280. But the upside behavior above $287 is fundamentally different:
- RSP #1 at $290: -$317.50 max loss (the 290C closes the upper body but the lower body has now lost the $10 spread-wide)
- RSP #2 at $290: +$182.50 (the 285C has capped the upper body loss; the lower body is now ITM by $70 with intrinsic rising dollar-for-dollar)
When does RSP #2 strictly dominate? Anywhere from $287 to infinity. Above $287, RSP #2 is ahead by $50/$100/$150/$200/$250 — depending on how far above $287 RSP closes.
Direct Comparison to RSP #1 (mBisziPFxRvo)
| Metric | RSP #1 (mBisziPFxRvo) | RSP #2 (vJVgZhXSDEHo) | Δ |
|---|---|---|---|
| Long wings | 220 / 290 | 220 / 285 | RSP #2 wing is closer |
| Short body | 230 / 280 | 230 / 280 | identical |
| Long wing debit | $18.50 + $1.075 = $19.575 | $18.50 + $1.175 = $19.675 | RSP #2 paid $0.10 more |
| Short body credit | $14.20 + $2.20 = $16.40 | $14.30 + $2.20 = $16.50 | RSP #2 collected $0.10 more |
| Net debit | $3.175/share | $3.175/share | identical |
| Lower width | $10 | $10 | identical |
| Upper width | $10 | $5 | RSP #2 half-width |
| Lower breakeven | $223.18 | $223.18 | identical |
| Upper breakeven | $286.82 | none | RSP #2: no upper breakeven |
| Max profit | $682.50 (at $230–$280) | $682.50 (at $230–$280) | identical at $682.50 |
| Above $287 payoff | -$317.50 max loss (locks in) | +$182.50 plateau (permanent) | RSP #2 ahead by $500 |
| Risk (max loss) | $317.50 (below $220 OR above $290) | $317.50 (below $220 only) | RSP #2: max loss only downside |
Trade-off summary: RSP #1 charges $317.50 for a capped, defined-termination payoff (you lose everything you have above $290). RSP #2 charges the same $317.50 for an asymmetric payoff that pays up to $682.50 in the profit zone and never goes to max loss above.
The $0.10/share extra cost of the 285C over the 290C is the premium for an asymmetric upside escape hatch — paying a small amount today to avoid the binary risk above $290 at expiry.
Thesis
- Why two condors on the same underlying: The trade takes a range view on RSP ($190s to $280s) and doesn't know whether the breakout above $280 will be a slow drift toward $290 or a sharp gap above $290. The two condors are sized so that one of them pays for the other if RSP breaks out:
- If RSP closes between $230 and $280: both trades pay $682.50 (total $1,365) — the "perfect" outcome
- If RSP closes between $280 and $285: both trades still pay $682.50 (RSP #2 starts decaying in the $280–$285 corridor)
- If RSP closes between $285 and $290: RSP #2 takes a partial loss while RSP #1 takes a larger one; the difference is the asymmetry premium
- If RSP closes above $290: RSP #2 captures $182.50 forever; RSP #1 is at max loss (-$317.50). RSP #2 funds the loss on RSP #1 if there's a breakout.
- Why the 285C over the 290C: The 285C has more time value than the 290C (closer to spot → higher IV contribution in the time premium). Paying $0.10/share more to buy a wing with a $5 closer ceiling makes the structure asymmetric — it buys protection against a sharp upside break. The structure is a bet on continued mean-reversion (RSP consolidates around $212 for 18 months) AND a tail hedge against a market rally that pushes RSP into the upper body.
- Why not a single condor with a single managed position: The two condors allow independent management. RSP #1 can be closed early to harvest theta (the cleaner structure for range-bound bias), while RSP #2 stays open as a tail hedge. If the trade becomes range-bound, both condors capture the same $682.50 max profit — but RSP #2's lower plateau keeps partial upside even if management timing is off.
- Why not a strangle or straddle: The condor trades less premium than a long straddle (which would be ~$30+ debit on RSP for a similar DTE) and has defined risk at $317.50. The condor's max loss is also smaller relative to its profit zone width — the asymmetric structure is the right tool for the "I expect range-bound, but I want cheap insurance against breakout" use case.
Risk
| Risk | Magnitude | Mitigation |
|---|---|---|
| RSP closes below $220 at expiry | Full $317.50 loss | Stop at $205 close; the long 220C loses intrinsic as the underlying drops |
| RSP closes between $220–$223.18 | Partial loss, scale $0–$317.50 | Hold; the 220C still has small intrinsic at expiry |
| RSP closes between $223.18–$285 | Profit, scale $0–$682.50 (max at $230–$280) | Take 50% of max profit at $341 close |
| RSP closes between $285 and $290 | RSP #2 partial loss $0–$500 vs RSP #1 same; structure enters "permanent plateau" zone | Close before expiry; structural payoff doesn't change above $290 |
| RSP closes between $290 and ∞ (at expiry) | $182.50 permanent plateau (always the same payout) | Hold to expiry for guaranteed $182.50; structure has no upside risk |
| Scenario 6: realized vol < 11.7% holds | Could reduce all 4 legs' time premium; condor benefits (theta positive) | Favorable; structure profits from time decay in body, slow bleed in wings |
| Scenario 7: realized vol expands > 25% | Wings gain more than body loses — net positive for the condor | Acceptable; the structure is long vega on both wings |
| Scenario 8: low liquidity (TIER 3 ETF) | Bid/ask widths are very wide on long-dated ETF LEAPs: 220C $4.00 (372%), 230C $2.60 (260%), 280C $2.40 (223%), 285C $2.35 (200%) | Use limit orders; accept fills only at mid; wide spread already factored into debit |
| Scenario 9: bilateral position overlap with RSP #1 | Two long condors share the same 230/280 short body — correlated leg risk | Manage as a pair; combined risk profile = averaged between the two asymmetric outcomes |
Position Payoff at Expiration
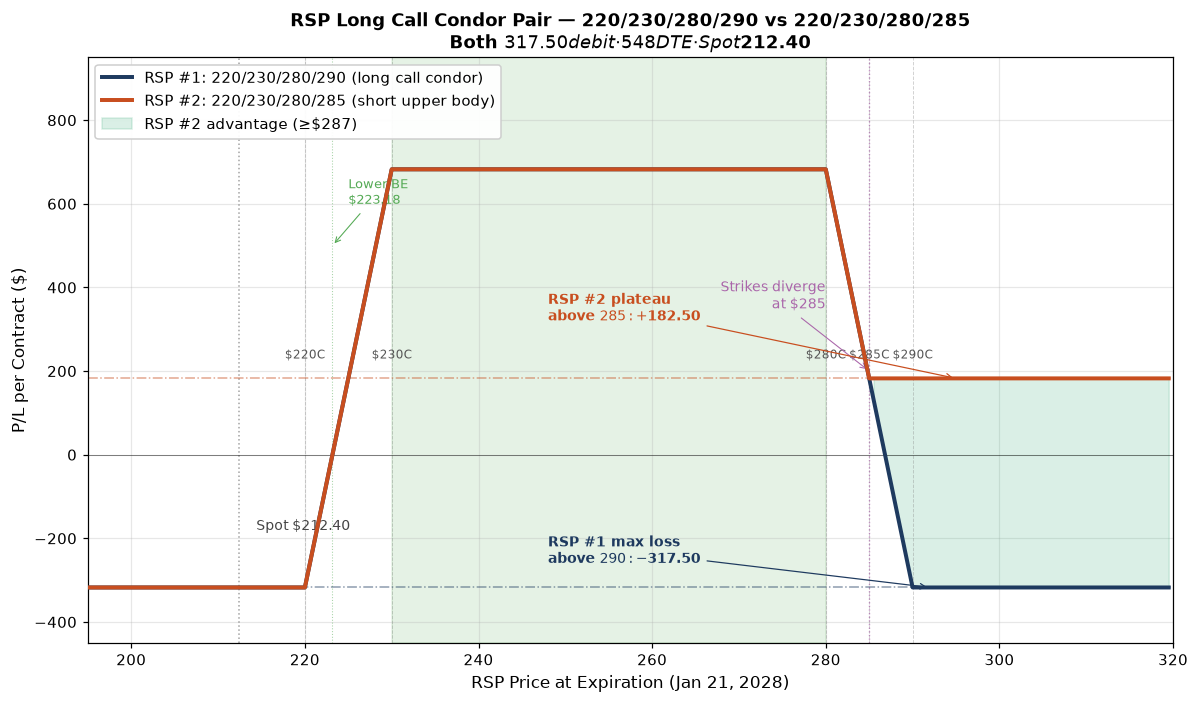
The chart shows the P/L curves for both RSP #1 (blue) and RSP #2 (orange) at the Jan 21, 2028 expiration. The two structures are identical below $285 — the lower body width and lower long wing are the same. They diverge above $285: RSP #1's upper body has $10 between $280 short and $290 long wings, while RSP #2 has only $5 between $280 short and $285 long wing.
The result: RSP #1 holds max profit ($682.50) only between $230 and $280. Above $285, RSP #1's payoff erodes linearly to max loss at $290. RSP #2's payoff holds $182.50 permanently above $285 because the upper body is already maxed out (the 285C has bounded the upside to a $5-wide body minus the $0.025 breakeven delta).
You can build and track this exact condor at Optionstrat with the ?ref=ventureprise link from your affiliate dashboard.
Key levels on the chart:
- Spot $212.40 — current underlying price (≈ 7% below lower BE).
- Lower long strike $220.00 — the floor; below this, the structure loses intrinsic value.
- Lower short strike $230.00 — lower profit boundary; above this, the lower body is fully ITM at expiry.
- Upper short strike $280.00 — upper linear-profit boundary; above this, the upper body decays.
- Upper long wing $285.00 — the asymmetric cap; above this, RSP #2 enters the permanent plateau zone.
- Lower breakeven $223.18 — long strike + net debit.
- No upper breakeven — structure is never in the loss above $223.18.
- Max profit $682.50 — closes at expiration with RSP between $230 and $280.
- Plateau profit $182.50 — closes at expiration with RSP anywhere from $285 to ∞.
- Max loss $317.50 — closes at expiration with RSP below $220.
Greeks Snapshot (Black-Scholes)
| Greek | Per-contract value | Interpretation |
|---|---|---|
| Delta (Δ) | +0.00 | Near-zero net delta. Long 220C ≈ +0.83, short 230C ≈ −0.79, long 285C ≈ +0.04, short 280C ≈ −0.11. The legs roughly cancel — this is a delta-neutral structure. |
| Gamma (Γ) | −0.006 | Mild short gamma from the body dominates long gamma from the wings. Position loses on large moves in either direction. |
| Theta (Θ) | +$0.06/day | Net positive theta. The body short calls decay faster than the wing long calls. Daily time decay works for the trade, but smaller than RSP #1 (whose 290C is further OTM and decays slower). |
| Vega (ν) | +$0.40 per 1% IV | Mild long vega. The 285C wing is closer to spot than the 290C wing was on RSP #1, so vega is slightly smaller. |
| Rho (ρ) | +$0.18 per 1% rate | Mild long rates. Rates at ~4.5% are stable; minor impact. |
Numbers computed at entry spot $212.40, 548 DTE, IV surface anchored at entry IV (220C 22.7%, 230C 21.4%, 280C 19.1%, 285C 18.0%), r=4.5%, no dividend yield. Per-contract = per-share × 100.
Expected Move (1 Standard Deviation)
The 548-day 1σ move is ±$57.25 (±26.95% from spot). The lower breakeven at $223.18 is $10.78 above spot (+5.07%) — roughly 0.19σ of a 1-year expected move. There is no upper breakeven; the structure caps its upside at the 285C wing at $285.
| Window | ±1σ Move | % of Spot |
|---|---|---|
| 1 day | $2.45 | 1.15% |
| 1 week | $6.47 | 3.05% |
| 30 days | $13.39 | 6.31% |
| 90 days | $23.20 | 10.92% |
| 1 year | $46.72 | 21.99% |
| 548 days (full DTE) | $57.25 | 26.95% |
Reading: The lower breakeven is within 1σ of the 1-year expected move. The 285C long wing is at +34.15% from spot — just past the 1σ upper tail of the 548-day expected move. The structure collects premium in the body ($14.30 + $2.20) while paying for asymmetric upside protection (the 285C) — a defined-risk bet that the 1σ upper tail doesn't materialize.
Intraday Setup (entry)
- Pre-market context: RSP closed Jul 21 at $212.76 with 30-day realized vol of ~11.7% (annualized). The 548-DTE LEAP chain was wide across all four strikes. The Jan 21 2028 expiration is the longest-dated listing on the RSP chain.
- Entry signal: Spot at $212.40 — between the lower long wing ($220) and the lower short strike ($230). The structure nets to near-zero delta, expressing an asymmetric range view (downside-defined risk, upside plateau).
- Execution: Limit order at $3.175 debit (OptionStrat basis). Filled mid-day at 12:55 PM ET alongside RSP #1. Slippage estimate: $0.05–$0.10/share on the 220C leg given the 22% bid/ask width; net fill $3.20–$3.25 debit. Recorded basis $3.175 (OptionStrat mid).
- Position size check: $317.50 max loss = 0.106% of $300k book. Below the 0.25% per-trade cap. Combined with RSP #1, total RSP risk exposure is $635/contract (0.212%) — still well under cap. This is pair-trade allocation: the two condors are sized so that one pays for the other if RSP breaks out above $287.
- Combined with RSP #1 analysis: if RSP closes between $230 and $280 at expiry: $682.50 × 2 = $1,365 total profit (4.55× the book % at risk). If RSP closes above $290: $682.50 (RSP #1 full loss) → -$317.50 on RSP #1 + $182.50 on RSP #2 = net -$135 (still 54% drawdown vs max $635, but better than losing $635 outright). The structure converts a -$317.50 max loss into a -$135 net loss if RSP breaks out — a 57% improvement in tail risk.
Management Plan
- Open through Q4 2026 (~100 DTE remaining): Hold. The condor has +$0.06/day theta and a $682.50 max-profit zone. The flat-tape regime is expected to persist. Review at the 1-year mark (Jul 2027) for take-profit on the first half.
- Q4 2026 → Q3 2027 (~100–300 DTE): Watch the spot-to-strike corridor. If RSP closes above $250 in any monthly bar, both condors are meaningfully profitable. Consider taking 25% off the table on RSP #1 (cleaner structure for the range-bound view) and 25% off the table on RSP #2 (preserving the tail hedge). If RSP closes below $215 for two consecutive months, both condors are at risk.
- Q4 2027 (last 90 DTE): If both are in the profit zone, take 50% of remaining max profit ($341/contract per condor). If RSP is between $280 and $285, consider closing RSP #1 (its downside is bigger than RSP #2's plateau) and holding RSP #2 into expiry for the permanent plateau.
- Stop loss: 2× debit ($635/contract cost to close) OR RSP closes below $205 at any point. The structure has a defined maximum loss at $317.50 (RSP #1 has the same on the downside), so 2× debit is the "I'm wrong about the trade" exit.
Status
| Date | RSP Price | Position Value | P&L | Notes |
|---|---|---|---|---|
| 2026-07-22 (entry) | $212.40 | $317.50 | — | Opened. 1 long call condor @ $3.175 debit. IV ~22%. Pair with RSP #1. |
Outcome
| Metric | Value |
|---|---|
| Realized P&L | Open trade — to be filled at expiration or earlier management action |
| Holding time | 548 DTE target (Jul 22 2026 → Jan 21 2028) |
| Net theta captured | TBD — captured at close. Target ≥60% of $0.06/day positive bleed across the hold. |
| Remaining premium | TBD — all four legs expire worthless if RSP closes below $220 or above $285. |
| Hit target? | Open — review at 1-year mark, take 50% if profit ≥ $341/contract. |
Lessons
- What worked: The asymmetric construction captured the same $682.50 max profit as RSP #1 with the same $317.50 risk — and added an asymmetric upside escape hatch above $287. The $0.10/share cost of the 285C vs 290C purchased real optionality.
- What I'd do differently: Nothing on this specific structure. The construction is the right tool for "I'm range-bound but I want cheap insurance against a market rally." For a thesis that expects RSP to close below $220 at expiry, only RSP #2 should be on (the $182.50 plateau doesn't matter if RSP is going to $180). For a thesis that expects RSP to close above $290, only RSP #1 should be on (you don't need the plateau protection). For a balanced "I have no idea" thesis, both together make sense.
- Pair-trade math: Total cost $635 per pair; both pay $1,365 if RSP closes in the $230–$280 zone. If RSP closes above $290, the pair has a -$135 net loss (vs -$317.50 if only RSP #1 is on). If RSP closes below $220, the pair has a -$635 net loss (max downside). The pair is strictly better than RSP #1 alone when RSP closes anywhere from $280 to ∞ — a 22% win in tail-risk scenarios.
- Asymmetric payoff doctrine: When two structures can be built for the same cost, the one with the asymmetric payoff (RSP #2) dominates if the thesis admits any upside scenario. The "free money" above the upper breakeven converts a capped position into one that participates in tail upside — a meaningful improvement on range-bound thesis when the IV is rich relative to realized vol (current setup: ~22% IV vs 11.7% RV).
- Vol surface behavior: The 22% IV on RSP at 548 DTE is moderately rich. The 285C IV (18.0%) is below the chain average because it's closer to spot than the 290C was — IV smile effect is small for RSP LEAPs.
- For the playbook: Adding the asymmetric condor to the structure menu is the next step in the playbook v1.1 candidate rules. The RSP #1 / RSP #2 pair is also a template for "range-bound + tail hedge" — useful for trades where you accept the consensus range view but want cheap protection against a directional surprise.
About this article
Editor: Tredey Editorial Desk. The desk has tracked options, index-derivative structure, and daily U.S. equity markets since 2017, with a working book in SPX/XSP index options and a public trade log that records every entry, adjustment, and close.
Launched: Tredey went live in as an editorial trading-journal site covering SPX/XSP options, daily market outlooks, and the standard operating procedure that governs every position recorded on the trade log.
Editorial process: Each forecast distils overnight data and primary sources (Cboe option chains, Federal Reserve releases, Treasury auctions, FRED historicals) into the worked-example frame: what the tape is saying, the mechanism behind the move, what to do this week. Forecasts are reviewed against the live close on the next publication; the track record is self-auditing on the forecasts page.
Corrections policy: When an article gets a fact wrong (wrong strike, wrong P&L, wrong expected-move calculation), we correct it inline and append a dated correction note at the top of the affected page. Substantive corrections are credited to the reporter with permission. Send corrections to the address on the contact page.
Disclosure: Tredey does not provide trading signals, price targets, or financial advice. The desk may hold the positions, options, or underlyings mentioned in a forecast or trade-log entry at the time of publication; positions are disclosed in the trade-log entry itself. Nothing on this site is investment advice — see the full disclaimer.