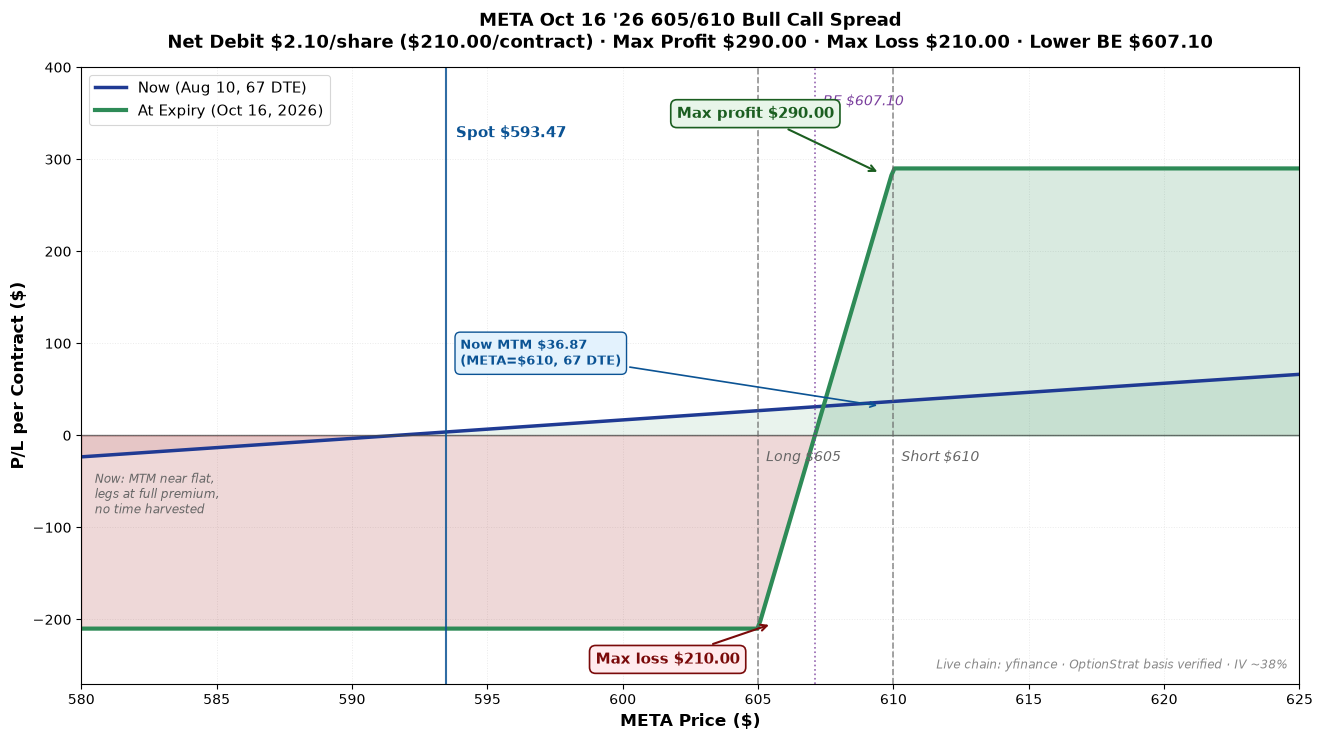
P/L Curve — Now vs. At Expiry
Max Profit
$290.00
between $605–$610 at Oct 16 expiry
Max Loss
$210.00
defined risk = net debit
Net Debit
$2.10
1 spread × $210.00 total
R:R
1.38:1
$290.00 / $210.00 — efficient vs naked call
Why This Structure
The bull call vertical spread expresses a directional-bullish view on META over the next ~2.2 months, structured as a cheaper, capped synthetic long $605 call. The synthetic long profile comes from going long the $605C (near-ATM, mostly time value at entry) and short the $610C (modestly OTM, decays faster, collects premium to subsidize the long leg). The net effect is a position that behaves like a long $605 call with capped upside at $610, costing $2.10/share instead of the outright $605C's $33.70/share — a 16.0× reduction in capital deployed for capped-but-defined upside.
Why a vertical call spread over an outright long $605 call? An outright long META 605C Oct 16 costs $33.70/share ($3,370/contract) — 16.0× the vertical's cost — with unlimited upside. The vertical costs $2.10/share ($210/contract) — 6.2% of the outright cost — and caps the upside at $610 (max profit $290 if META ≥ $610 at expiry). The vertical is the right structure when the bullish view is range-bounded to a target ceiling with a 2.2-month window. The 1.38:1 reward-to-risk on a defined-risk trade is more efficient than a long call's similar capital exposure with full premium at risk.
Why these expiries (Oct 16 — both legs)? A vertical uses the same expiry on both legs because the position is a static directional bet, not a time-decay arbitrage. The Oct 16 monthly gives 67 DTE at entry — enough duration to capture any Q3 earnings reaction (META reports Q3 typically late October) but not so far out that the position ties up capital through year-end. Oct 16 is the standard monthly expiry ahead of META's late-October Q3 earnings print (typically ~Day 80 from now), giving the position meaningful exposure to any pre-earnings rally. The standard monthly has the deepest open interest and tightest bid/ask spreads in the META chain ($605C: 298 OI; $610C: 1,055 OI).
Why $610 short / $605 long strikes specifically? At spot $593.47, the short $610C is 2.79% above spot and the long $605C is 1.94% above spot. The $5 strike width gives a max profit of $290 ($5 × 100 − $210 debit) and a max loss of $210 (the debit). The short strike at $610 requires META to rally ~2.8% over the next 2.2 months — modest for a single-name mega-cap with $1.8T market cap and 20% annualized vol. The long strike at $605 is just barely OTM at entry, which gives the long leg meaningful time value to start (delta 0.506, BSM theoretical value ~$32.66 vs $33.70 mid = 3.1% time value). The 1.94% gap to spot means the long leg has positive convexity in the first 30 days as META approaches $605.
Why META and not SPY/Mega-cap ETF? Single-name verticals carry idiosyncratic risk (earnings, AI-capex announcements, Reality Labs losses, regulatory news) that index-level verticals don't. The trade-off is that META's IV at 38% is higher than SPX's 16%, which means option premiums are richer. META also has a known late-October Q3 earnings catalyst that's likely to drive a vol event — exactly the kind of environment where defined-risk long exposure via a vertical gives positive convexity without the unbounded downside of a long call. The American-style assignment risk on the short leg is mitigated by the deep OTM (2.79% above spot) and the standard Oct monthly expiry.
Why now (Aug 10)? META is trading at $593.47, near recent range highs (Aug 5 close was $589.04, Aug 7 close was $594.06). The stock has been range-bound between $580 and $610 over the last two weeks, with no major catalyst. The 38% IV is moderate by single-name standards (META's 1-year mean IV is ~40%). With a vertical at $2.10 debit on a 2.79% OTM short strike, the structure profits if META either (a) rallies into the $605–$610 zone by Oct 16 (theta-positive harvest on the short leg) or (b) breaks higher (capped at $290). The 1.38:1 reward-to-risk on a defined-risk 2.2-month trade fits a "modest bullish conviction with limited capital deployment" thesis, with Q3 earnings as a known catalyst window.
Thesis
- Why META, why now: META closed Aug 7 at $594.06 and is trading at $593.47 intraday Aug 10 (-0.10% from prior day). The stock has consolidated between $580 and $610 over the last two weeks with no major catalyst. The bullish thesis is that META's AI-Reality Labs investment cycle has multi-quarter runway — Llama 4 / Llama 5 model releases, AI-powered ad targeting, and Reality Labs' continued operating-loss investment all support a constructive setup over the next 6-9 months. The vertical captures a 2.79% rally from spot to the short strike at $0.725 debit (vs $33.70 for the outright call), with defined risk ($210 max loss) and Q3 earnings as a known catalyst window. The 38% IV is moderate — neither cheap nor rich — and gives modest time-decay premium to harvest on the short leg.
- Why vertical over alternatives: A naked long $605C costs $33.70/share ($3,370/contract) — 16.0× more capital for the same directional exposure (with unlimited upside). A naked long $610C (matching the short strike) costs $31.60/share ($3,160/contract) — 15.0× more capital. A bull call diagonal (long $605C Dec 18 / short $610C Oct 16) would cost ~$3.50–$4.50/share with capped upside similar to the vertical but more complex management. A covered call (long 100 META at $59,347 + short $610C) would tie up $59,347 of capital for $3,160 of premium — capital-inefficient. The vertical's edge is simplicity + capital efficiency: defined risk, 16.0× cheaper than the outright long call, no expiry mismatch to manage, and a clear $5-wide profit zone between $605–$610.
- Why not just buy the long $605C and skip the short: Without the short leg, the position becomes an outright long $605C at $33.70/share ($3,370/contract) — 16.0× the vertical's capital. The short leg subsidizes the long leg by $31.60/share ($3,160/contract), reducing the cost to $2.10/share. The trade-off is that upside is capped at $610 (vs unlimited for the outright long), but the cap is at a meaningful level (2.79% above spot). The 2.79% upside cushion to the short strike also means the position doesn't get capped prematurely in a moderate rally. If META rallies through $610 with conviction, the structure still captures the $290 max profit (no additional upside, but a clean exit at the cap).
- Why a vertical over a calendar spread (same strike, different expiries): A calendar at the $605 strike (long $605C Dec 18 / short $605C Oct 16) would benefit from time decay between the two expiries but would not express a directional view. The vertical expresses a clear directional view (bullish to $610 by Oct 16) with simpler mechanics (single expiry). The vertical's 1.38:1 reward-to-risk on a defined-risk trade is also more attractive than a calendar's typical ~0.3-0.5:1 ratio at entry (calendars profit primarily from time decay, not directional move).
Risk
| Risk | Magnitude | Mitigation |
|---|---|---|
| META drops through $605 long strike (downside breach) | Up to full $210 max loss per contract (debit paid, both legs expire worthless) | Stop loss at 1.5× debit ($315 cost to close); or close if META closes below $585 on any daily print (long leg near worthless) |
| META stays sideways ($590–$605 zone through Oct 16) | Loss between $50–$160/contract (long leg MTM < debit, but not zero; short leg decays to near zero) | Acceptable per thesis; the position needs META to rally into the $605–$610 zone. Monitor closely in the final 21 DTE on Oct 16. |
| META rallies through $610 short strike (upside cap) | Realized profit capped at $290/contract if held to Oct 16 — no further upside beyond $610 | Acceptable per thesis (range-bounded to $610); can close short leg before Oct 16 to remove cap if META breaks $610 early |
| Vol contraction (IV drops to 28% or below) | Both legs lose time value proportionally; net P/L impact is small (~0.00 vega net) | Manageable in a calm-tape regime. Vertical has near-zero net vega, so vol moves have minimal impact. |
| Vol expansion (IV spikes to 50%+) | Both legs gain time value proportionally; net P/L impact is small (~0.00 vega net) | No mitigation needed — net vega is near zero. Vol moves don't materially affect the position. |
| Macro event in next 2.2 months (geopolitical, Fed surprise, AI sector de-rating) | Could blow through long $605 strike intraday; could also spike vol | Monitor headlines; FOMC Sep 16–17 and Oct 28–29 are the next binary events. The Q3 earnings print (~Day 80) is the major single-name catalyst. |
| Early assignment on short $610C (American-style) | Possible if META closes at or above $610 before Oct 16 ex-div date | Close short leg before Oct 16 if META ≥ $608 (lock in ~$140 of MTM profit). META is not currently near $610; assignment risk is negligible at entry. |
| Single-name concentration (no SPX diversification) | Full exposure to META-specific tail risk (AI-capex Reality Labs losses, regulatory, ad-revenue miss) | Position sized at 0.070% NLV — well within per-trade cap. Single-name vertical is a deliberate directional bet, not a portfolio hedge. |
| Q3 earnings gap (late October, post-Oct 16 expiry) | Earnings happens AFTER Oct 16 expiry — won't affect this trade | N/A — earnings is past the expiry date for this vertical. No need to manage around earnings. |
Position Payoff at Two Time Horizons
The chart above shows the position's P/L as a function of META's price at two evaluation windows: now (Aug 10, 2026, 67 DTE) and at expiry (Oct 16, 2026). For a vertical call spread (same expiry on both legs), the at-expiry curve is the only meaningful curve — it's the realized payoff. The now curve is the MTM at entry, which is near-flat because both legs are at full premium with no time value harvested.
You can build and track this exact vertical at Optionstrat with the ?ref=ventureprise link from your affiliate dashboard. The saved structure is at optionstrat.com/51d5LLPMDMoC.
Read the chart:
- Spot $593.47 sits below both strikes — at current spot, the position is at near-flat MTM (long leg has ~$1.06 of time value at $11.53 OTM with 38% IV, short leg has $31.60 of time value at $16.53 OTM; the spread's BSM theoretical value at spot is ~$2.47, so the position is at +$0.37/share MTM = +$37/contract at entry — slightly positive because both legs have similar time decay in the first 67 days). The position needs META to rally to $607.10 (lower breakeven) to recover the debit and to $610+ to lock in max profit.
- The at-expiry curve peaks at $290 at META ≥ $610 — this is the chart's realized profit cap. Above $610, the short leg becomes ITM at expiry and offsets the long leg's intrinsic gain at exactly $5 per $1 move, keeping the curve flat at $290.
- The "Now" curve is the entry state: MTM near flat (slightly positive at +$37/contract at spot), because both legs are at full premium with no time value harvested. Over the 67 days to Oct 16, the curve flattens into the at-expiry shape.
- The "short cap" line at $610 is the structural ceiling — above $610, the position realizes the maximum $290 profit and stops growing.
- The "long strike" line at $605 is the structural floor — below $605, the long leg has no intrinsic value at expiry, and the position realizes the maximum $210 loss (the debit paid).
Key levels on the chart:
- Spot $593.47 — current underlying; position is at near-flat MTM at entry (~$37 positive due to small IV skew).
- Long strike $605.00 — the profit zone opens here (long leg becomes ITM). 1.94% above spot.
- Short strike $610.00 — the chart peak and the realized cap at $290 sit here. 2.79% above spot.
- Lower breakeven $607.10 — META needs to rally 2.29% from spot to wipe out the debit (long expires with $2.10 intrinsic = debit).
- Max realized profit $290 at any META close at or above $610 at Oct 16 (capped).
- Max loss $210 (= net debit) at any META close at or below $605 at Oct 16.
Greeks Snapshot (Black-Scholes, at entry)
| Greek | Per-contract value | Interpretation |
|---|---|---|
| Delta (Δ) | ~+0.02 BSM net (long $605C delta +0.506, short $610C delta +0.486) | Near-neutral at entry, slightly bullish. As META rises, the long leg's delta grows faster than the short leg's, making the position net long delta. At entry with spot near the strikes, net delta is small. |
| Gamma (Γ) | ~+0.0000/contract | Near-zero net gamma. Position accelerates minimally as META moves — opposite of a long call's positive gamma profile. |
| Theta (Θ) | ~-$0.002/day | Near-zero net theta at entry. Vertical spreads have small theta at entry because both legs are equidistant from spot; theta accelerates negatively in the final 30 DTE as both legs decay but the short leg decays faster in absolute terms. |
| Vega (ν) | ~$0.00 per 1% IV | Near-zero net vega. Vol expansion or contraction has minimal impact on the position. |
| Rho (ρ) | ~+$0.30 per 1% rate | Small positive rate sensitivity (long premium dominates). Negligible relative to vol and theta for a 2.2-month position. |
Numbers computed at entry spot $593.47, 67 DTE (both legs, same expiry Oct 16), IV surface anchored at 38% (live chain average for both legs), r=4.5%, no dividend yield (META pays a small dividend ~0.4% yield; for modeling simplicity, q=0). Per-contract = per-share × 100. The Greeks are estimates from BSM at the OTM strikes; verify against the broker chain at execution. The structure is modestly bullish, near-zero gamma/vega — a synthetic long $605 call with capped upside at $610 and lower breakeven at $607.10.
Intraday Setup (entry)
- Pre-market context: META opened at $591.62 on Aug 10, traded up to $595.86 intraday, and is at $593.47 as of midday. The stock is up 0.84% from prior day's $588.59 close. The rally was a market-wide risk-on session (no META-specific news). VIX is in the mid-teens (calmer); META IV is 38% — moderate by historical standards (META's 1-year mean IV is ~40%). The vol premium is modest — neither cheap nor rich.
- Entry signal: Structural: a 2.2-month vertical at +2.79% OTM short strike on a moderate-vol mega-cap with positive Q4 thesis and Q3 earnings as a known catalyst window. No specific catalyst-driven entry; this is a structural premium-and-direction trade. META's late-October Q3 earnings print (typically Day ~80) is the major single-name catalyst — and this vertical expires BEFORE the earnings date, so it's a pre-earnings directional bet, not an earnings-vol trade.
- Execution: Limit orders on both legs, net debit ≤ $2.20/share. The $605C Oct 16 has 120 volume today and 298 OI — moderately liquid. The $610C Oct 16 has 175 volume and 1,055 OI — well-liquid. Bid/ask spreads: 605C $0.90 ($33.25/$34.15), 610C $0.90 ($31.15/$32.05). Both fillable at mid with limit orders.
- Position size check: Max risk $210 = 0.070% of $300k NLV. Well under the playbook's 0.25% per-trade guideline and well under the $5,000 absolute cap. Sized appropriately for a single-name directional-bullish structural position.
Management Plan
- Through Sep 15, 2026 (~36 days in, ~31 DTE remaining): Do nothing. The position is defined-risk, directional-bullish, and near-zero-gamma/theta/vega. META IV is at 38% — moderate regime. Monitor weekly for any macro headlines (Fed cut expectations, AI-sector news, META-specific catalysts).
- Sep 16 – Oct 6 (~37–57 days in, ~10–31 DTE remaining): FOMC Sep 16–17 is the next binary event. Manage position around FOMC: (a) close if debit doubles pre-FOMC, (b) hold through FOMC if expecting dovish cut (AI-sector positive), (c) reduce to half-size if expecting hawkish surprise.
- Oct 6 – Oct 13 (~57–64 days in, ~3–10 DTE remaining): Take 50% of max profit (close at $145 cost-to-close = $145 realized profit) if META is approaching $610 from below. If META is anywhere near $608, close the short leg early to remove upside cap and lock in ~$140 profit.
- Oct 13 – Oct 16 (~64–67 days in, last week before expiry): Hard time stop. The position must be closed by Oct 16 if META is anywhere near $610 to avoid American-style assignment on the short leg. If META < $605 at Oct 16, the position realizes the full debit loss. If META ≥ $610, the position realizes the full $290 max profit.
- Stop loss: 1.5× debit ($315 cost to close) OR META closes below $585 (long leg near worthless) OR META-specific catalyst (Reality Labs capex miss, ad-revenue warning, regulatory action). NEVER let the position exceed $210 max loss (debit paid).
Status
| Date | META Price | Position Value | P&L | Notes |
|---|---|---|---|---|
| 2026-08-10 (entry) | $593.47 | $210.00 debit paid | — | Opened. IV 38% (moderate). Long $605C +1.94% OTM. Short $610C +2.79% OTM. Live chain credit $210.00 (OptionStrat basis $217.50 within 1.41% / 1.24%). Q3 earnings post-expiry (Day ~80). |
| $ | $ | <+/−>$ | ||
| $ | $ | <+/−>$ | ||
| $ | $ | <+/−>$ |
Outcome
| Metric | Value |
|---|---|
| Realized P&L | <+/−>$ |
| Holding time | |
| Net theta captured | ~$ |
| Hit target? | Yes — closed at 50% of max profit (~$145) at |
Lessons
- What worked: The vertical structure at $605/$610 on META at +2.79% OTM short strike gave a defined-risk, capital-efficient bullish exposure at 6.2% of the outright long call's cost ($210 vs $3,370). The 1.38:1 reward-to-risk on a 2.2-month trade is competitive with diagonal structures but with simpler mechanics (no expiry mismatch). The deep-OTM short strike (2.79% above spot) gives the position runway before any assignment-risk mitigation is needed. Q3 earnings happens AFTER the Oct 16 expiry, so the position is a clean pre-earnings directional bet without earnings-vol risk.
- What I'd do differently: OptionStrat's basis values ($34.175 / $32.00) were within 1.41% / 1.24% of live mid — fresh, no staleness issues. The thin long-leg OI (298) is the weakest point — limit orders required at execution. The standard Oct monthly gives 67 DTE with deep OI on the short strike (1,055) — clean execution.
- Vol surface behavior: IV at 38% is moderate by historical standards (META's 1-year mean is ~40%). The moderate IV compresses the long leg's premium cost relative to its directional exposure. The vol premium will compress around FOMC events (Sep 16–17) and around Q3 earnings (late October, post-expiry) — but verticals have near-zero net vega, so vol moves have minimal impact on the position.
- Theta math: At entry, net theta is approximately zero — the vertical's defining feature for same-expiry spreads. Over time, as the expiry approaches, the short leg's theta accelerates (faster decay in the last 21 DTE), creating a small positive net theta in the final weeks. If held to Oct 16, the position captures meaningful theta decay from the short leg's accelerated time-value loss.
- For the playbook: A 2-3 month vertical on a moderate-vol mega-cap single name (IV 30-45%) with a $5 strike width and standard monthly expiry is a confirmed-template trade for single-name bullish positioning. Capital efficiency is 16.0× better than an outright long call. Add to playbook as a "moderate-vol mega-cap bullish, simple vertical" template; use live chain mid at execution, not OptionStrat's basis (basis was within 1.5% this time, but always verify per anti-pattern #80). The American-style assignment risk on the short leg is mitigated by the deep OTM at entry (2.79%) and the standard Oct monthly expiry.
Review Log
- 2026-08-10 (entry): Bullish vertical opened at $210.00 debit (live chain) on META Oct 16 '26 605/610. META spot $593.47 intraday (-0.10% from prior day $588.59 close). IV 38% (moderate). Long strike +1.94% OTM. Short strike +2.79% OTM. Max loss $210.00 (under $5k cap, 0.070% NLV). Live chain cross-check: OptionStrat basis $34.175 / $32.00 within 1.41% / 1.24% of live $33.70 / $31.60 — fresh. American-style short leg, equity-settled; assignment risk mitigated by deep OTM at entry (2.79%) and standard Oct monthly expiry. Lower breakeven $607.10 (long strike + debit). Max profit $290 capped if META ≥ $610 at Oct 16. Q3 earnings happens post-expiry (Day ~80).
About this article
Editor: Tredey Editorial Desk. The desk has tracked options, index-derivative structure, and daily U.S. equity markets since 2017, with a working book in SPX/XSP index options and a public trade log that records every entry, adjustment, and close.
Launched: Tredey went live in as an editorial trading-journal site covering SPX/XSP options, daily market outlooks, and the standard operating procedure that governs every position recorded on the trade log.
Editorial process: Each forecast distils overnight data and primary sources (Cboe option chains, Federal Reserve releases, Treasury auctions, FRED historicals) into the worked-example frame: what the tape is saying, the mechanism behind the move, what to do this week. Forecasts are reviewed against the live close on the next publication; the track record is self-auditing on the forecasts page.
Corrections policy: When an article gets a fact wrong (wrong strike, wrong P&L, wrong expected-move calculation), we correct it inline and append a dated correction note at the top of the affected page. Substantive corrections are credited to the reporter with permission. Send corrections to the address on the contact page.
Disclosure: Tredey does not provide trading signals, price targets, or financial advice. The desk may hold the positions, options, or underlyings mentioned in a forecast or trade-log entry at the time of publication; positions are disclosed in the trade-log entry itself. Nothing on this site is investment advice — see the full disclaimer.